Jenkins User interface
By default, Fuego uses the Jenkins continuous integration system to manage boards, tests, logs, and test results.
The Jenkins user interface is web-based. This page shows several screenshots of different pages in the Jenkins interface.
Through this interface, you can see the status of tests that have run, review the logs for tests, and schedule new tests to run on target boards. You also use this interface to add new boards and new tests to the system.
Note that Jenkins objects are:
nodes
jobs
builds
views
These are different from the Fuego names for the same objects. The first three of these Jenkins objects correspond to the Fuego objects of: boards, tests and runs, respectively.
Main dashboard
The main dashboard of Jenkins looks like the following:
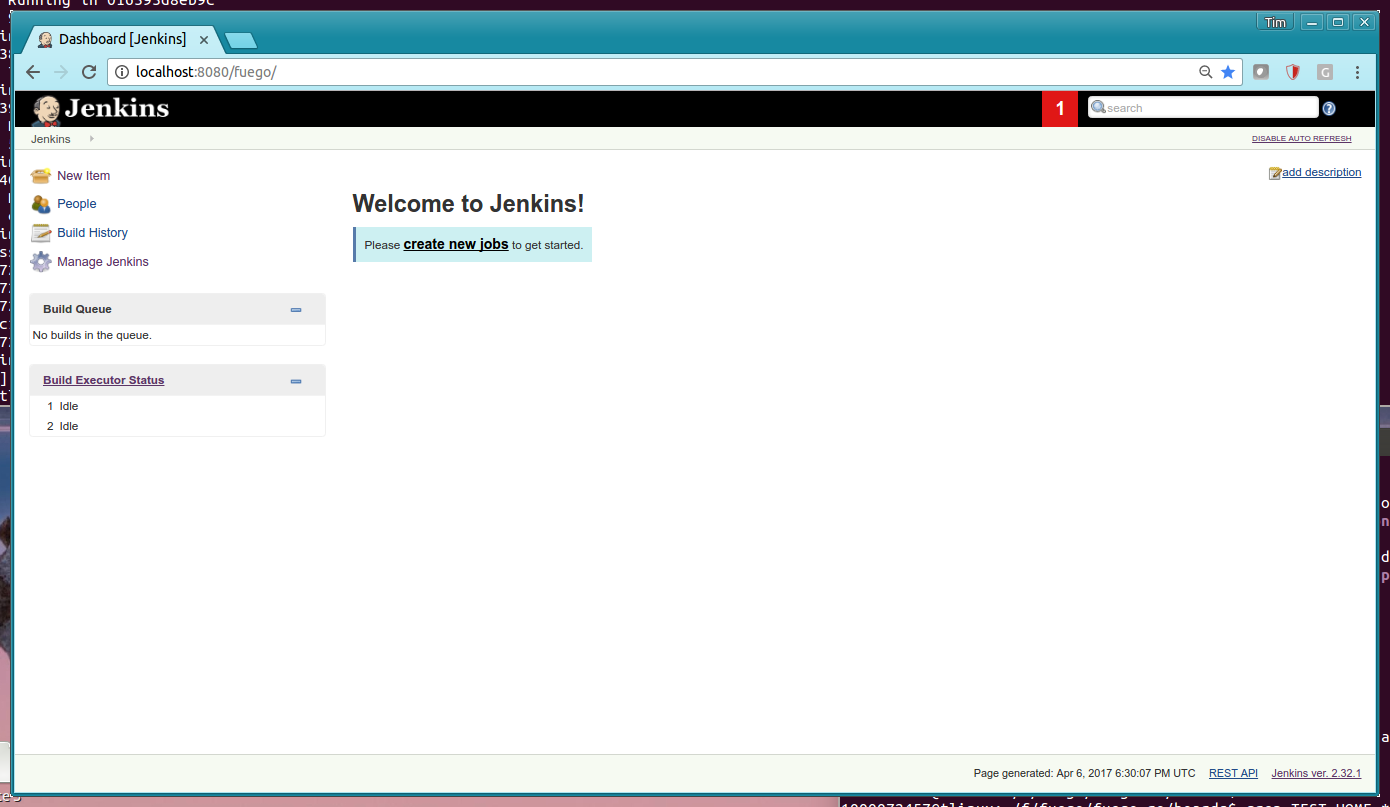
New Installation
When Fuego has just been installed, there is nothing in the Jenkins interface (no nodes, jobs or views). The interface should look something like this:
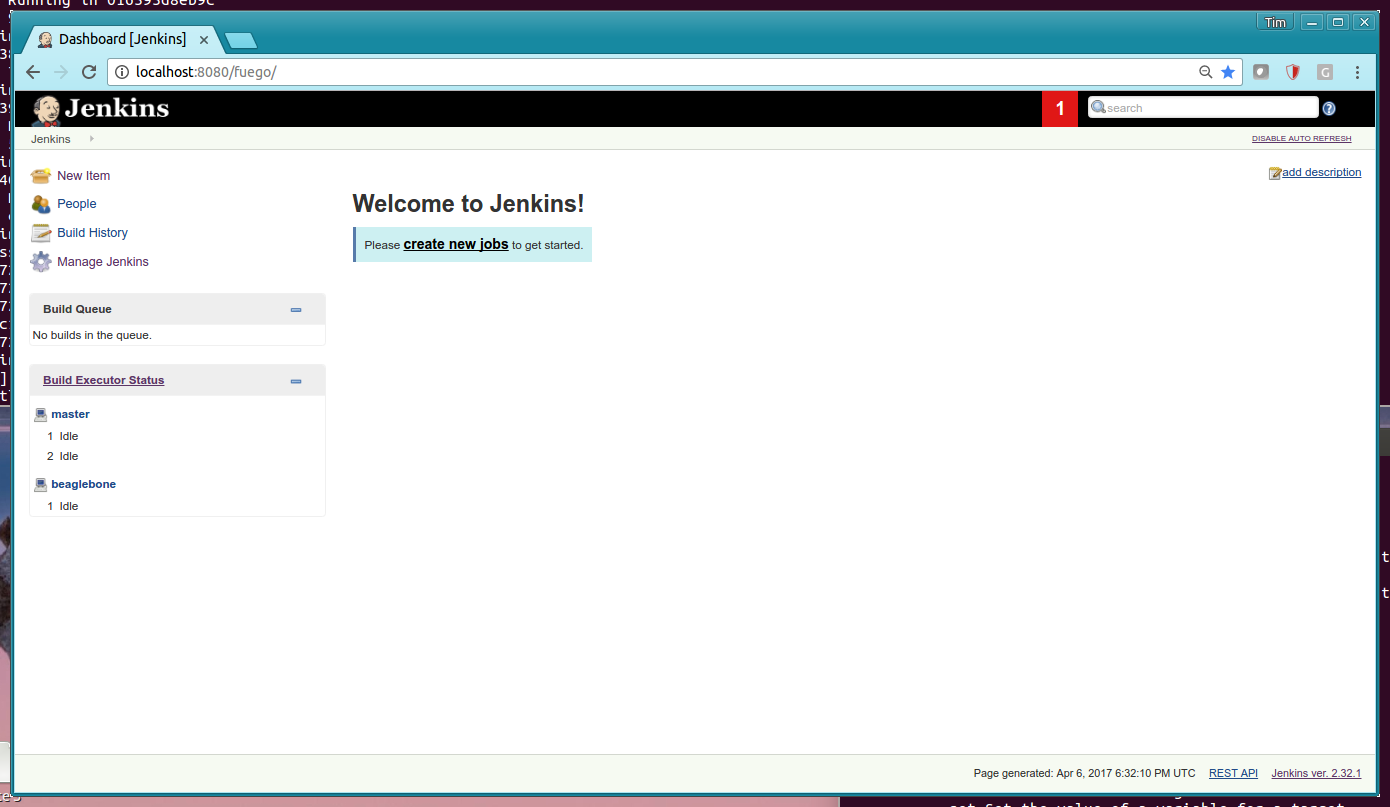
With a single node (board) added
Here is the main dashboard of Jenkins, after a single node (called ‘beaglebone’ in this case) has been added. Note the node (board) appears in the left sidebar under “Build Executor Status”:
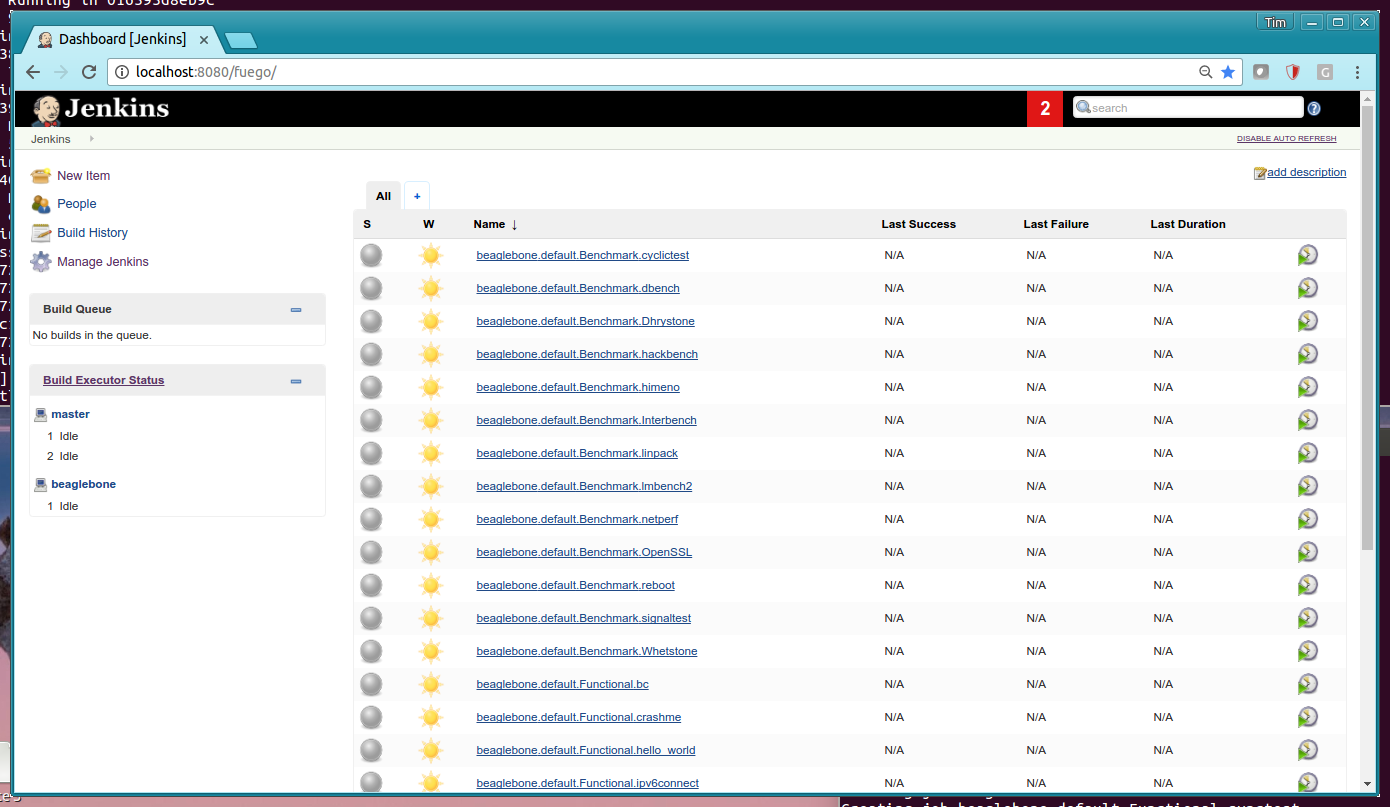
With beaglebone node and jobs
Here is the main dashboard of Jenkins, showing a single node (beaglebone) and jobs for this board.
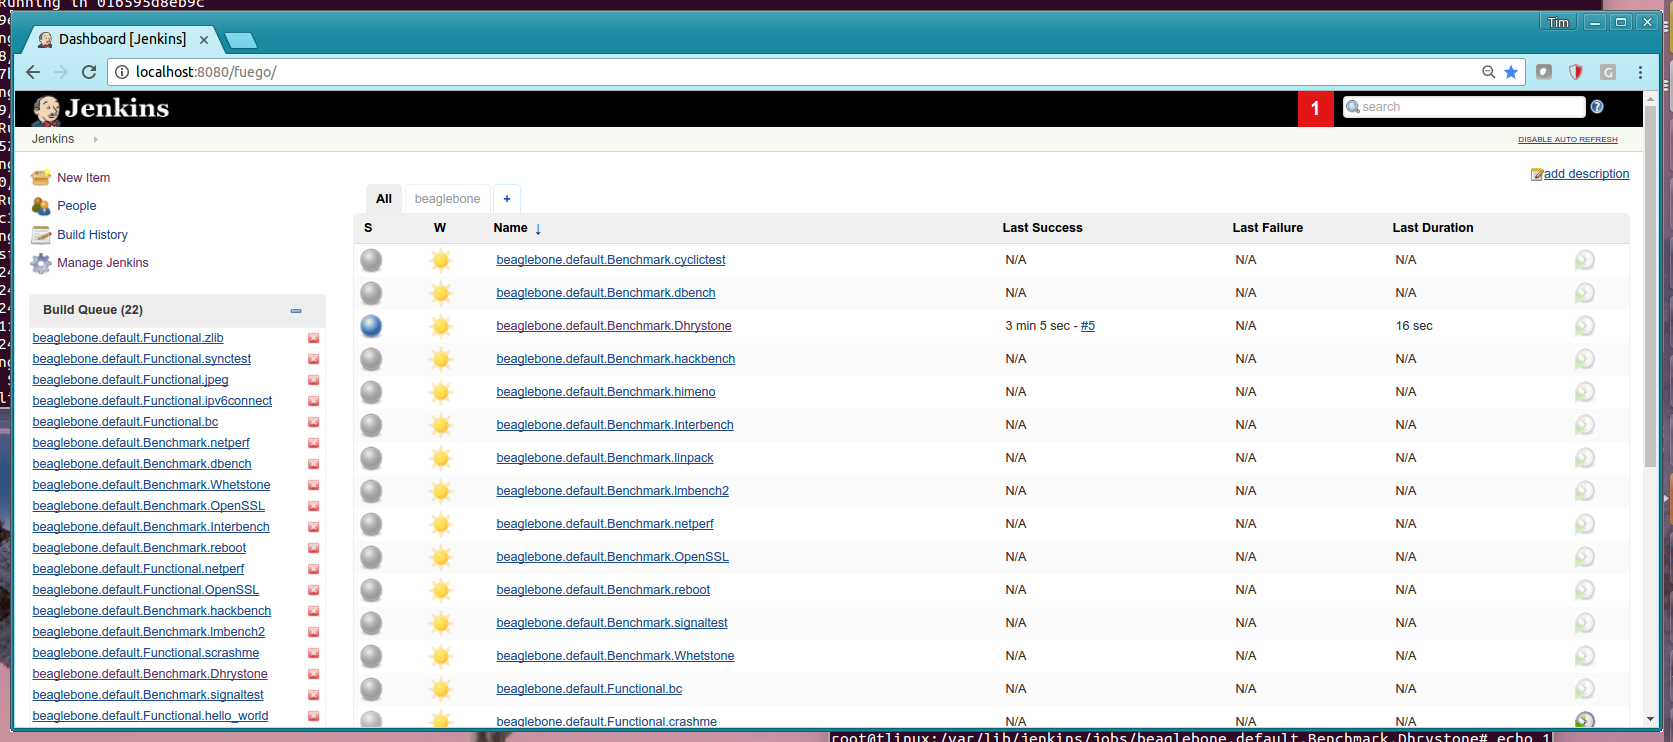
Dashboard with jobs in Build Queue
Here is the Jenkins dashboard with a lot of jobs in the Build Queue. Note the list of jobs in the left side-bar, in the “Build Queue” pane.
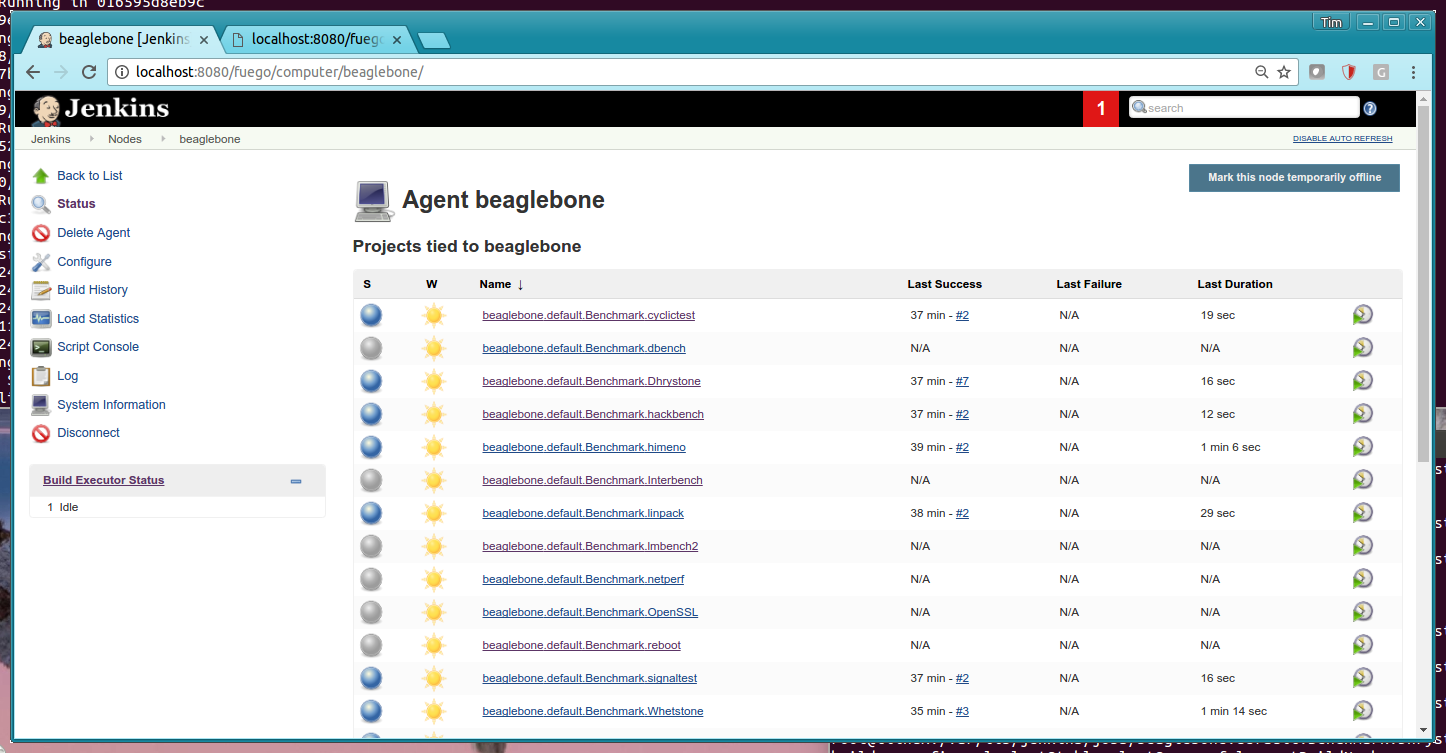
Node pages
If you click on the node in the Build Executor Status pane, then you can see a list of the jobs associated with a node.
Node status page
Here is the status for the beaglebone node.
Job pages
If you click on a job in the Jenkins interface, you can see information about an individual job. This page shows information about the status of the job, including a Build History for the job (in the left sidebar).
You can start a job by clicking on the “Build Now” button in the left menu.
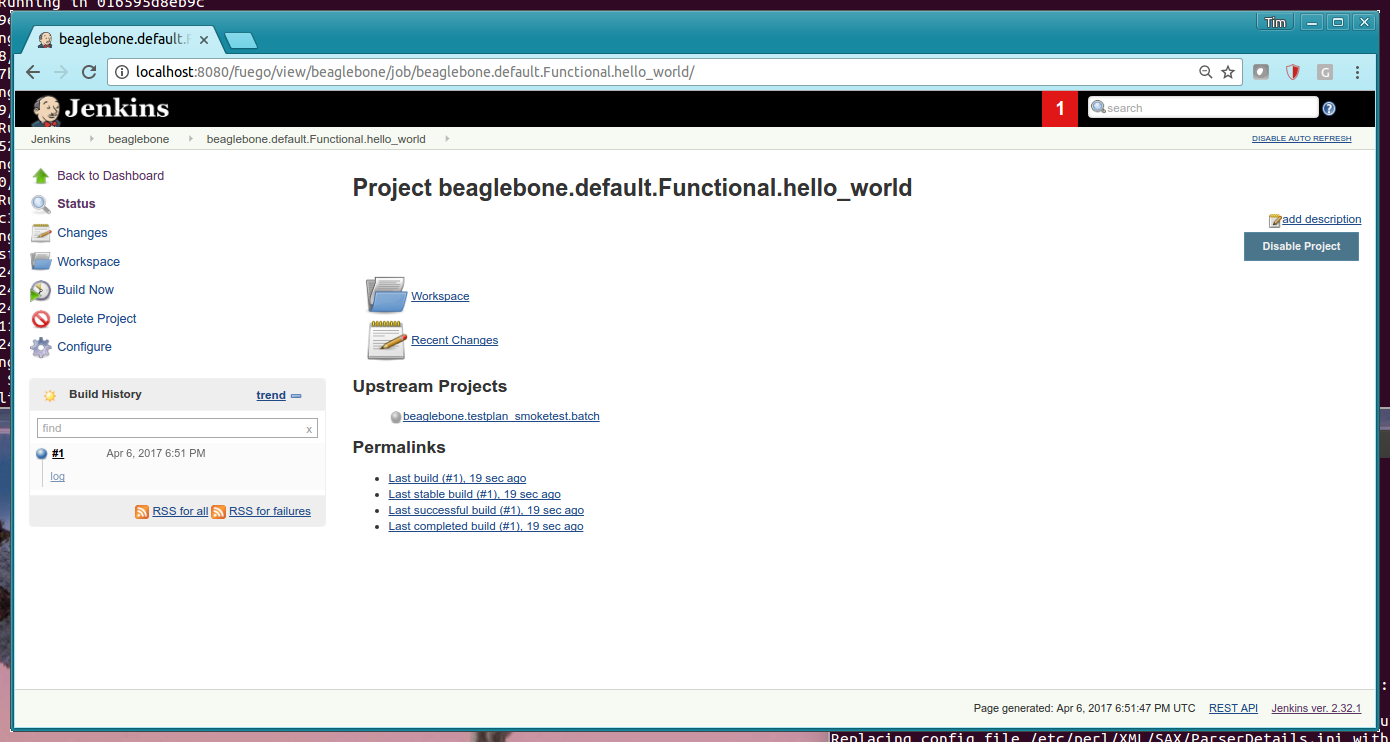
Functional job status page
Here is a page showing the status information for a Functional test called ‘hello_world’. The main area of the screen has information about the last successful and failed builds of the test. Note the left sidebar pane with “Build History”, to see individual test execution results.
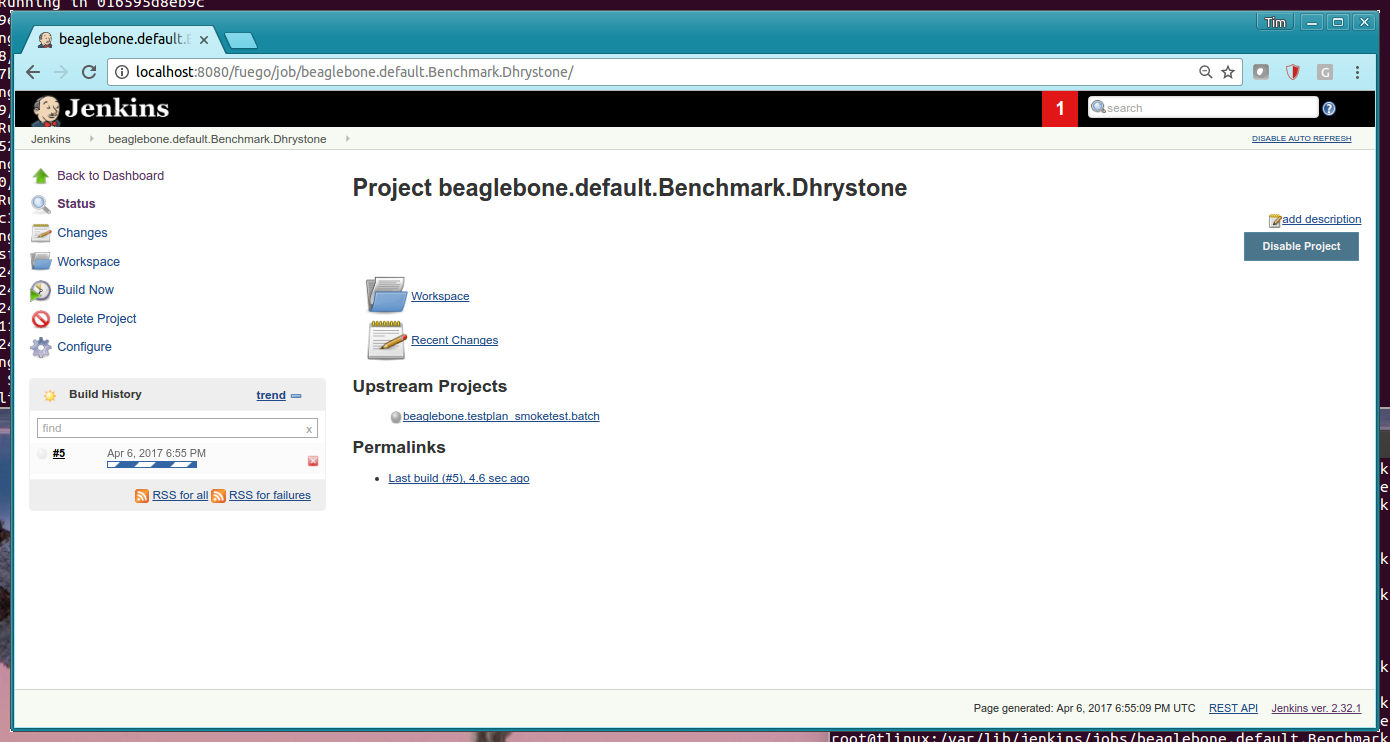
Benchmark job - starting a build
Here is a picture of a job build being started. Note the progress bar in the Build History pane in the left sidebar.
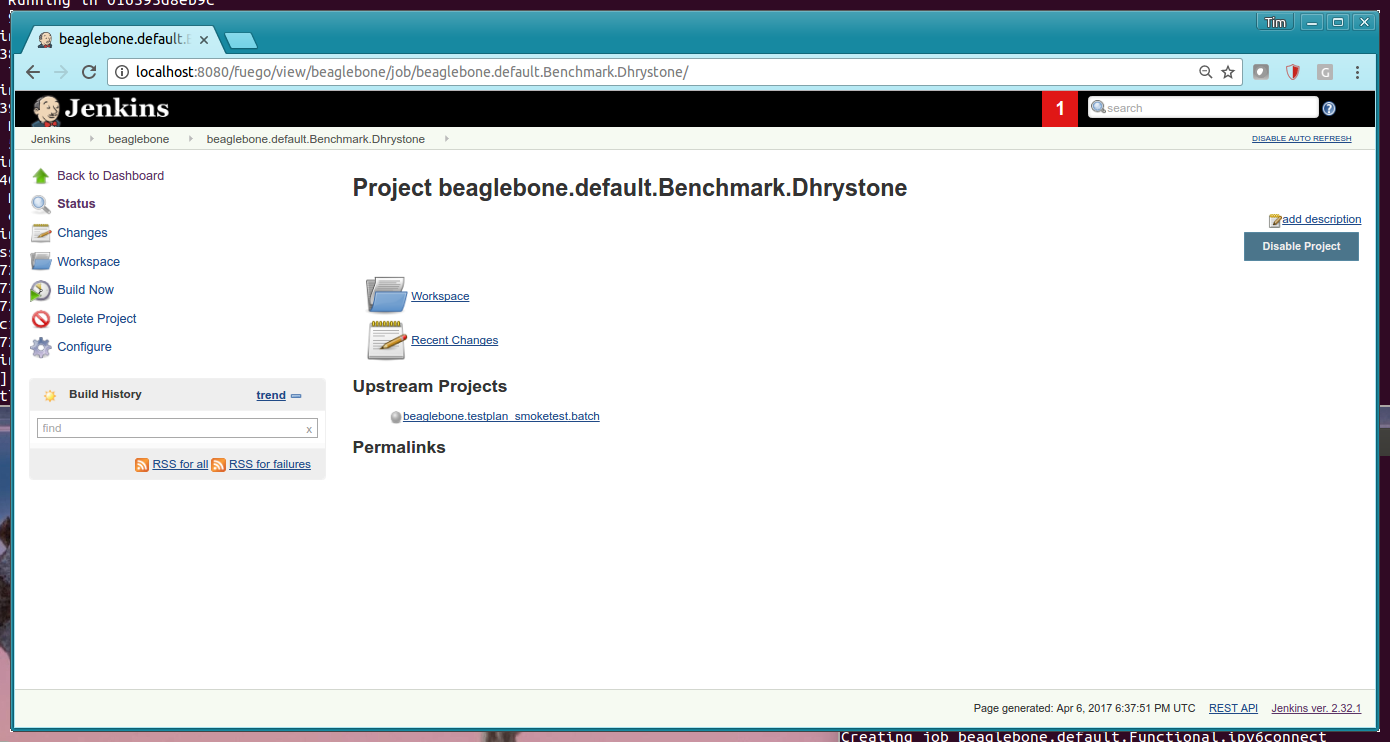
Benchmark job - before successful execution
Before a Benchmark job completes it has no data to plot on it’s chart, and appears similar to a Functional Job status page:
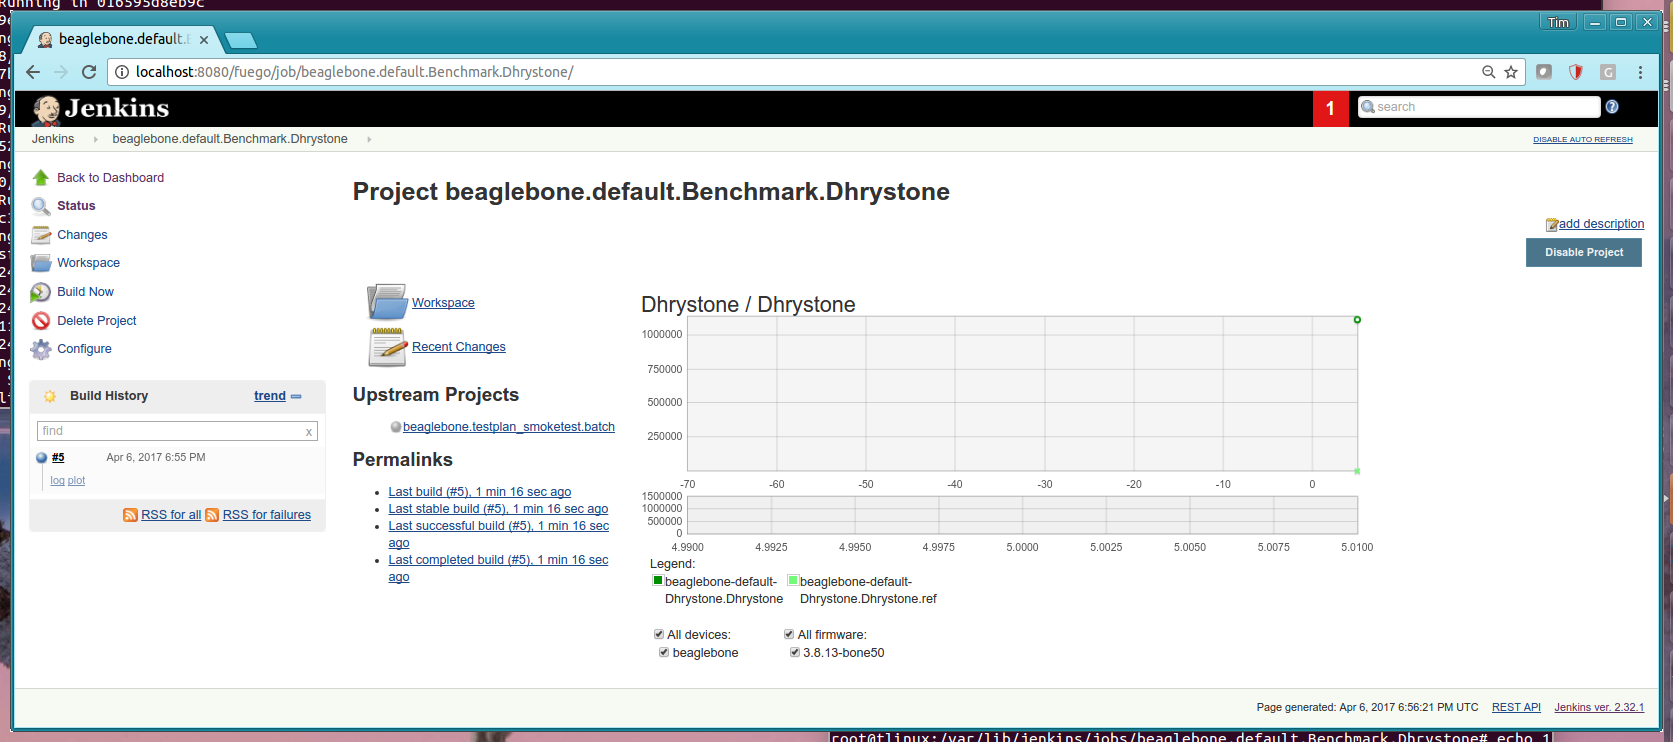
Benchmark job - with plot of metrics
Normally, a Benchmark page shows one or more plots showing the values for data returned by this benchmark.
Build pages
A build page shows the results of a single execution of a job (test) on a board. You can click on the build number in the Jenkins interface to see this page.
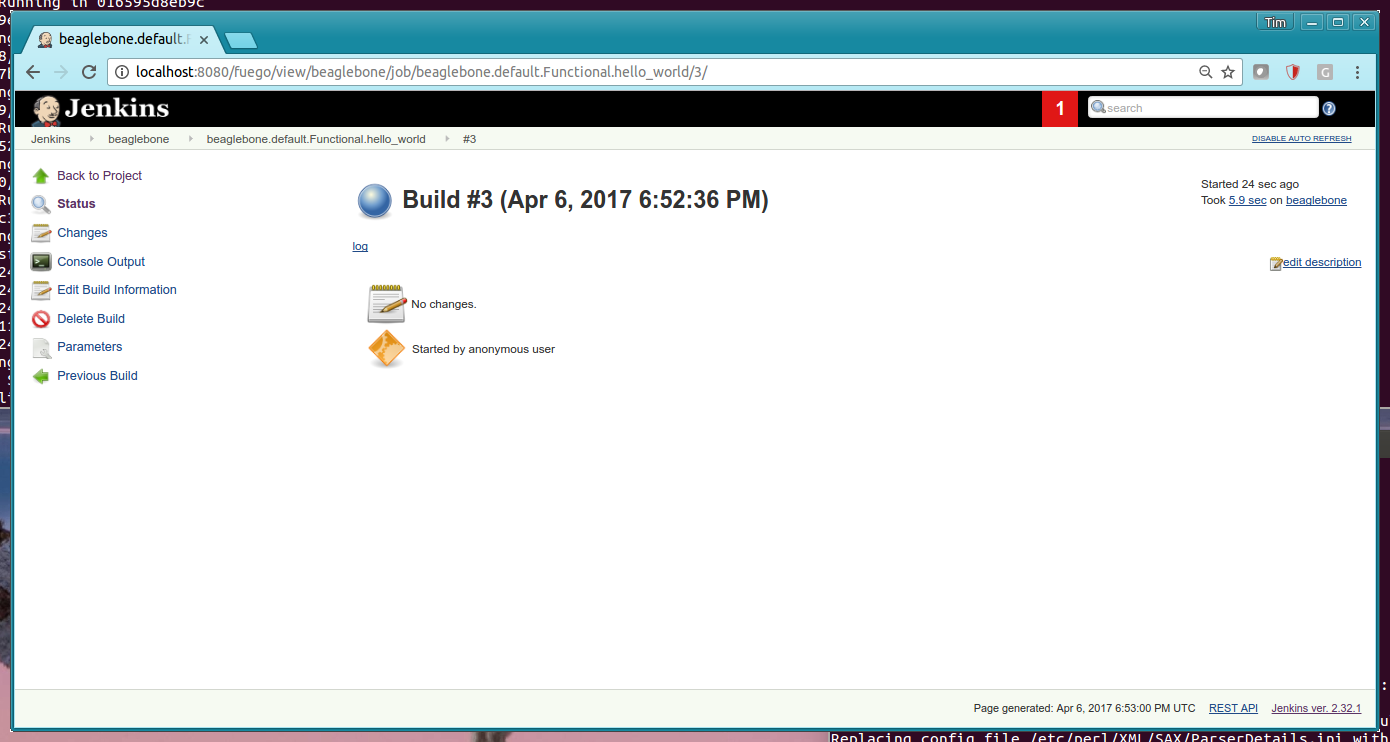
Results from a job build
Here are the results from the execution of the “hello world” job. This was the results of running the Fuego test “Functional.hello_world” on a beaglebone board.
Test log results
You can examine the different logs for each test. Each test produces a log from the program that ran on the board. This is available by following a link called “log” from the ‘build’ page for that test run. You can see the console log, which shows the output of commands for this test, by clicking on “console log” in the build interface (or the build drop-down menu in the Build History list).
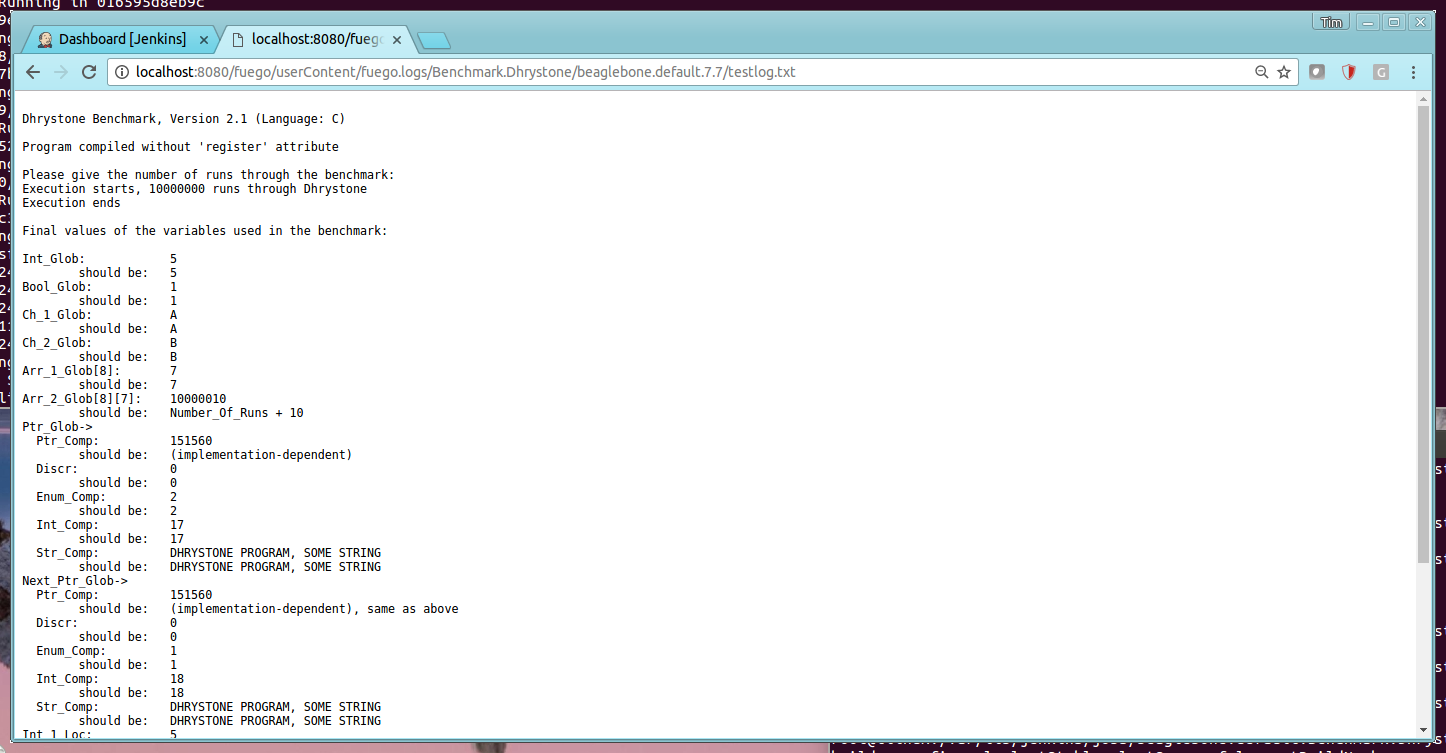
Drhystone test log
Here are results from a run of the Dhrystone test on a beaglebone board:
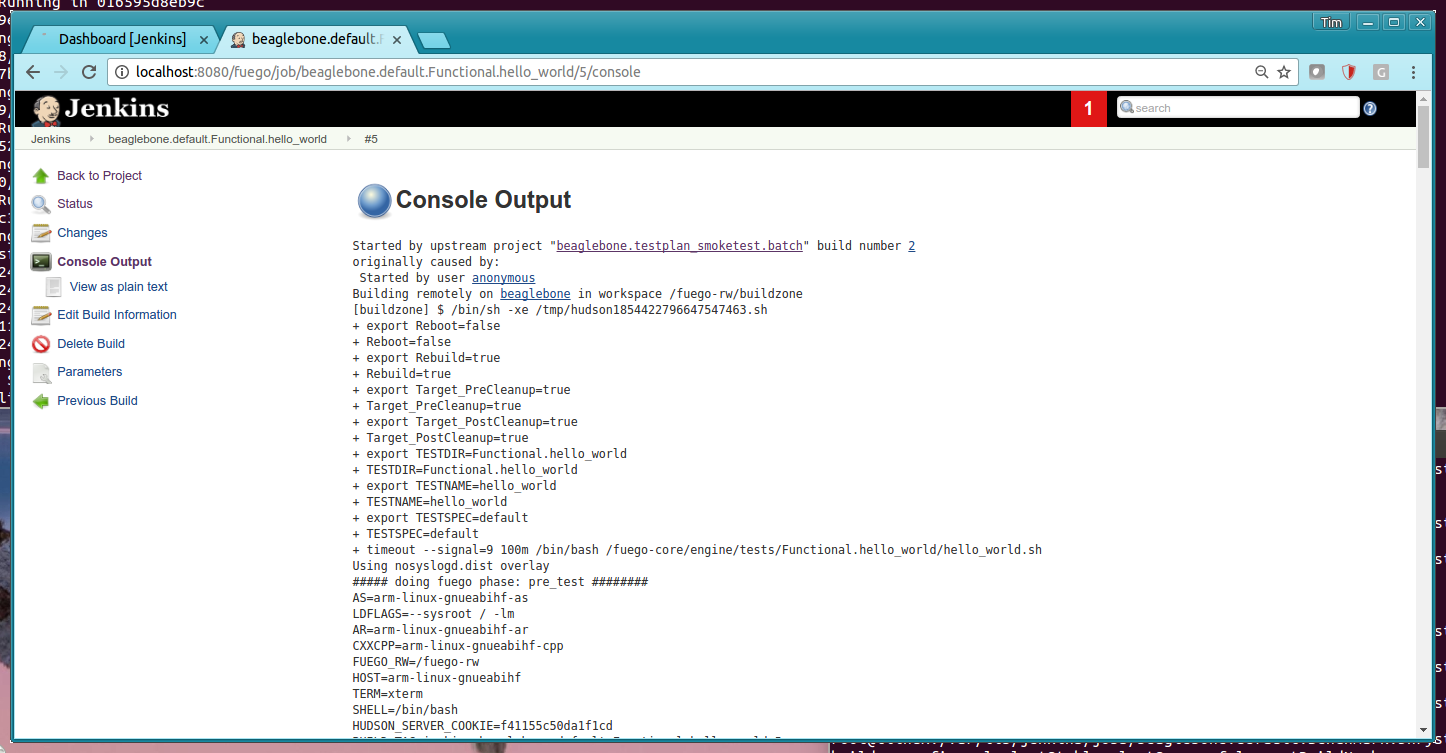
Jenkins Console log
Here is the console log for a test executed on the beaglebone:
View pages
A view is an area in the main dashboard that shows a collection of jobs with a particular set of status columns for each job. They appear as tabs in the main dashboard view of Jenkins. You can create your own view to see a subset of the jobs that are available in Jenkins
Here are some screen shots showing how to add a new view to Jenkins.
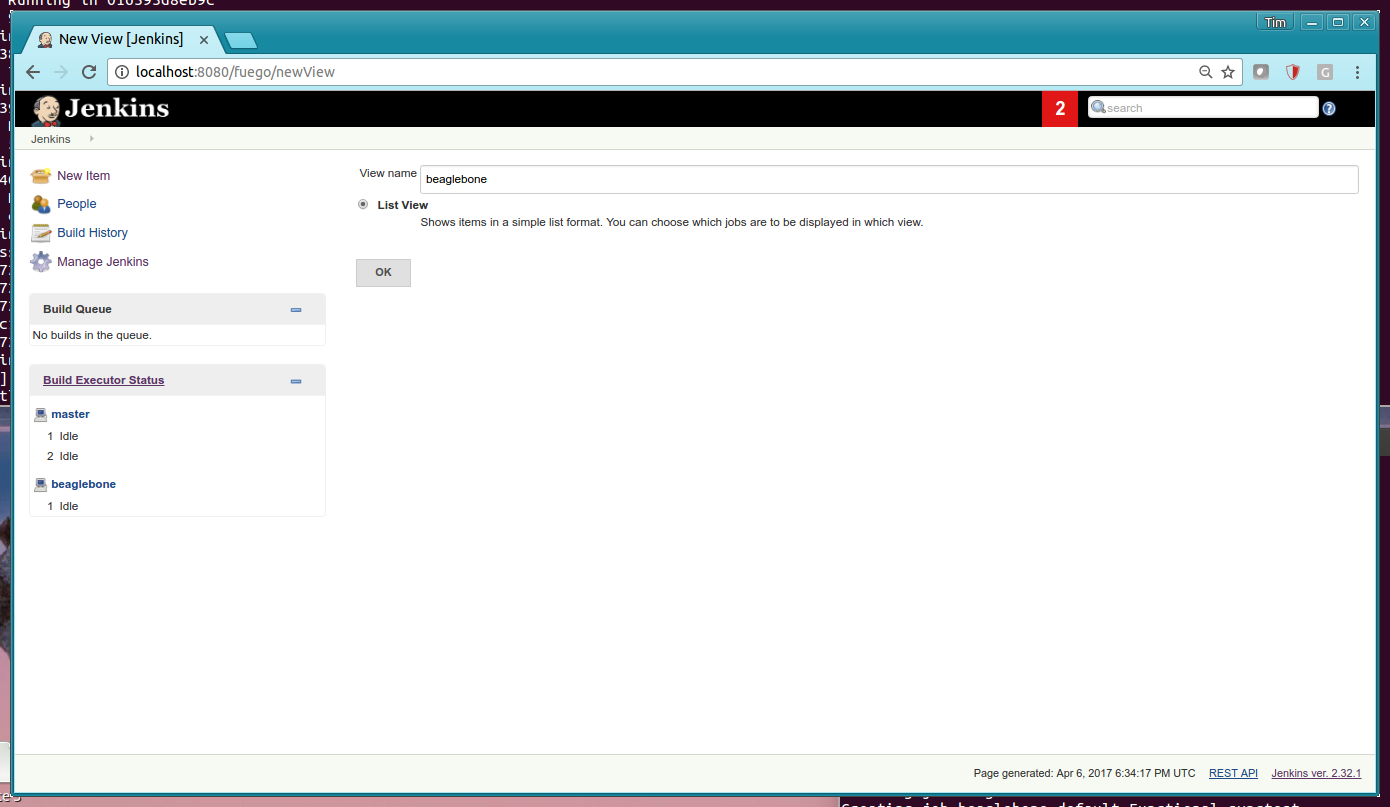
Screen to add a new view
Here is the screen to add a new view to Jenkins.
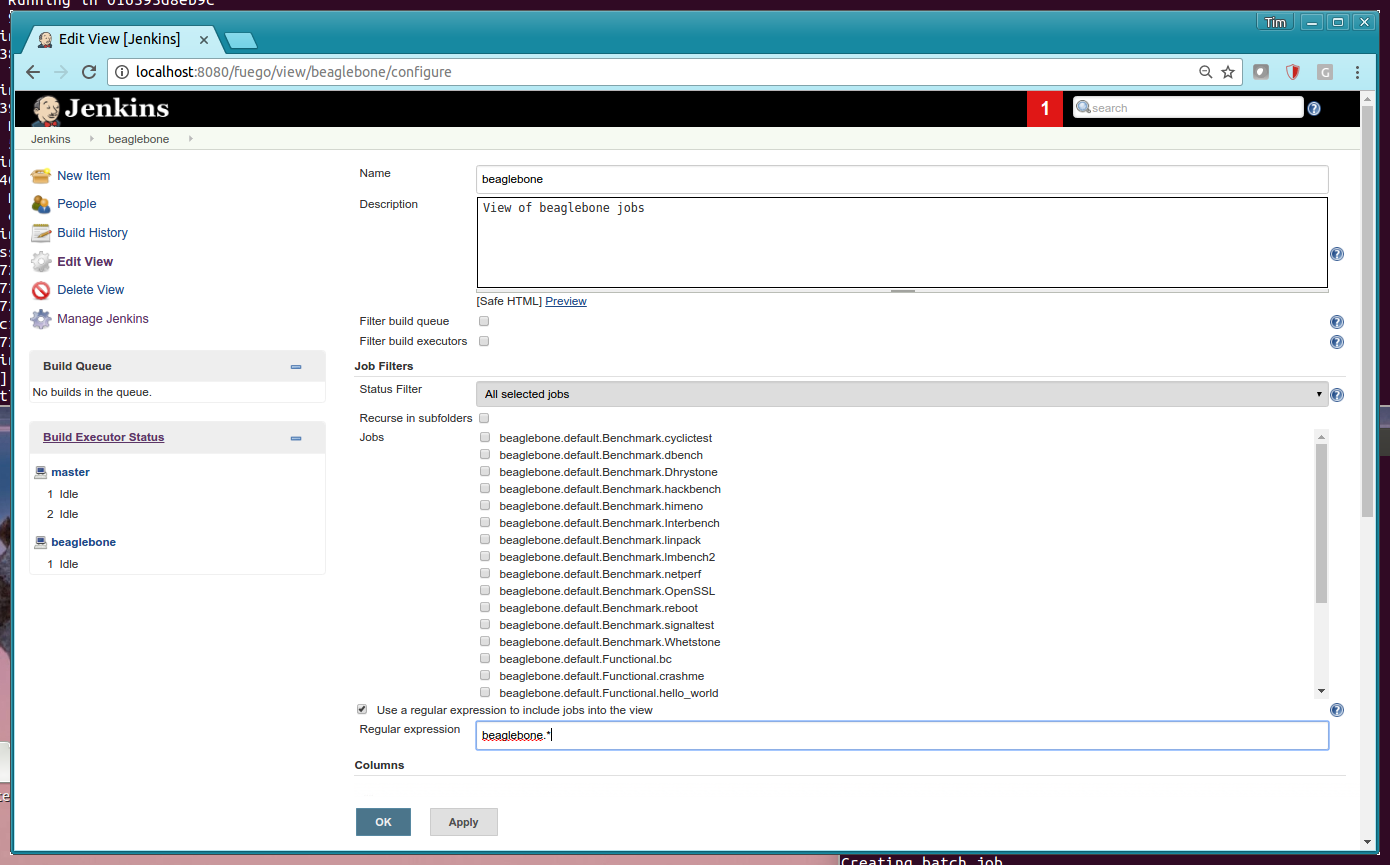
Screen to configure the view settings
Here is the screen to configure view settings. Note the use of a regular expression to control what jobs to see in this view. You can also control what status columns to display in the view.
Other Jenkins pages
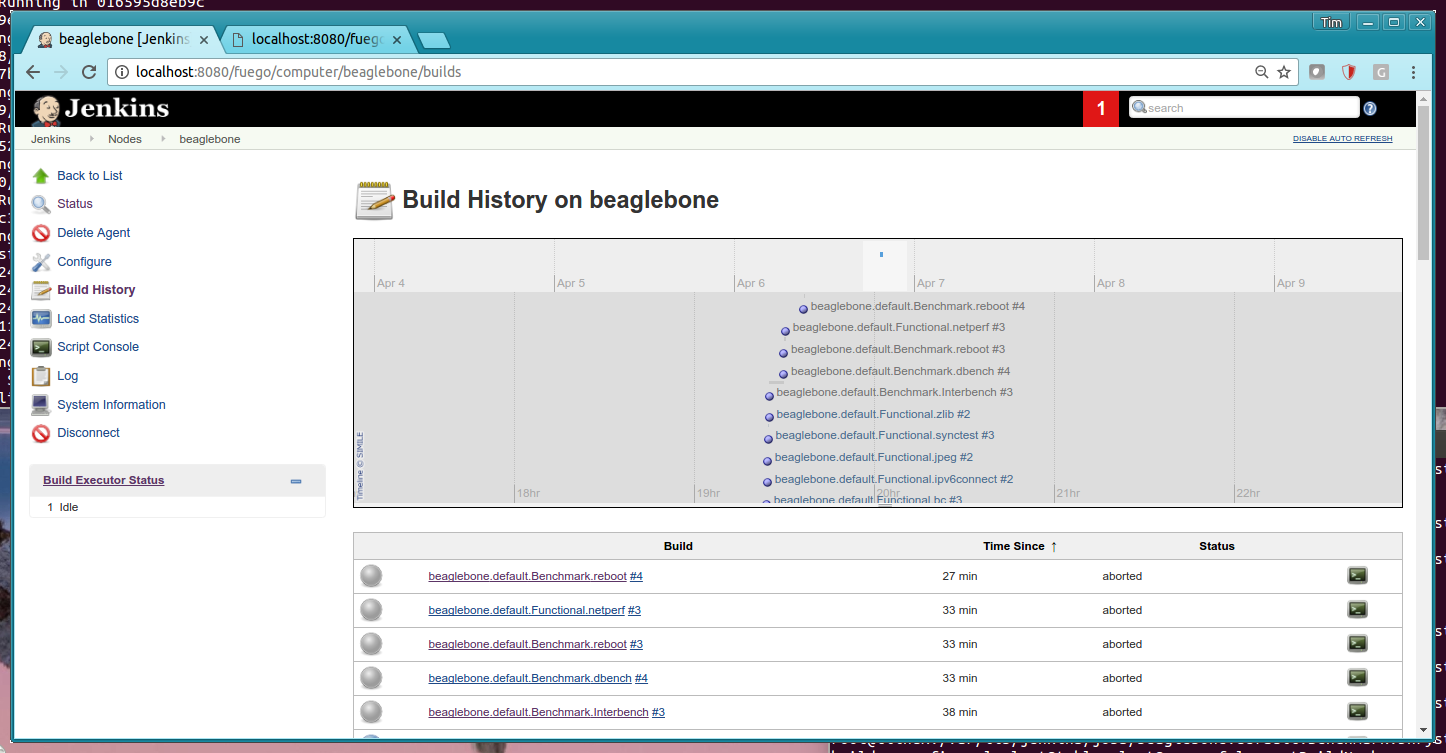
Build History
The global build history page is available by clicking on the Build History link in the main dashboard page of Jenkins. It shows the execution time and status for a recent time period.
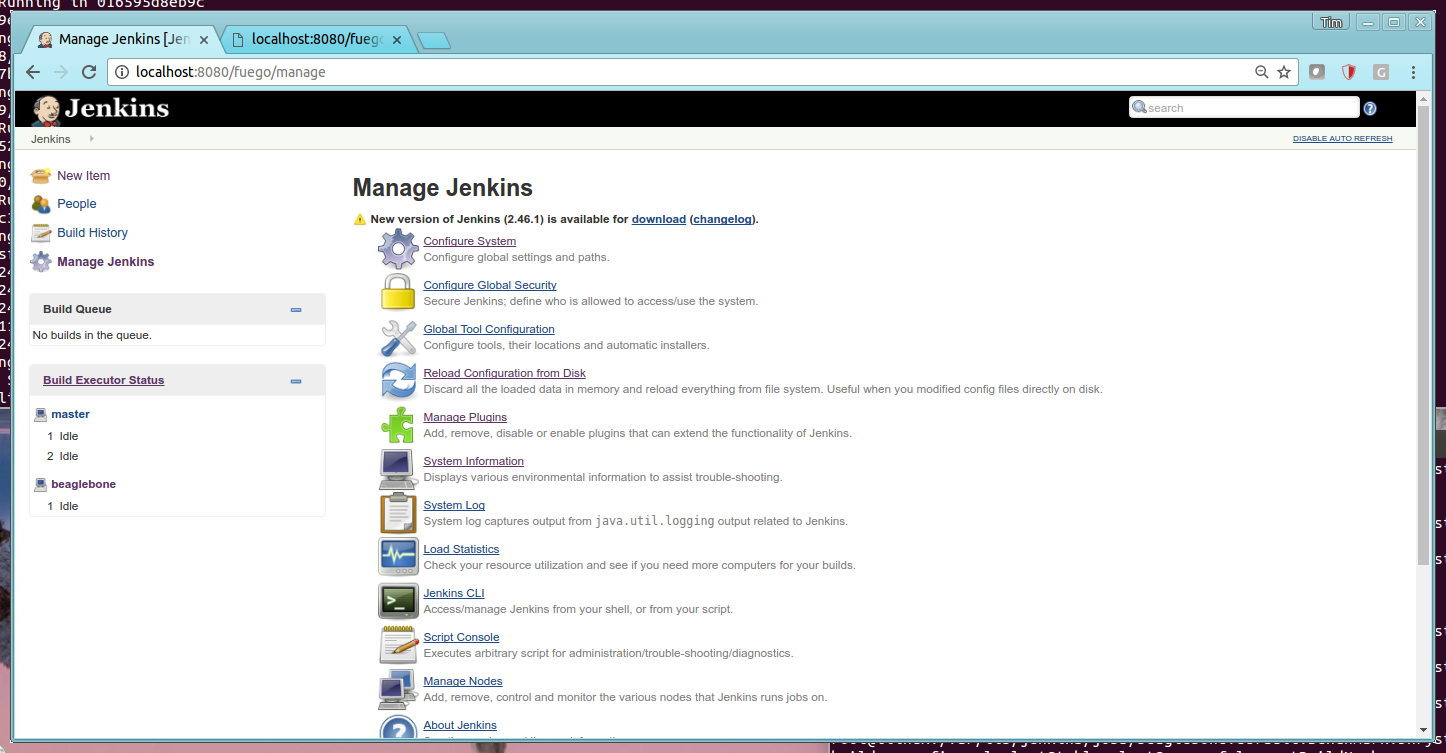
Jenkins management
You can manage Jenkins using the Manage Jenkins page, available from the top-level dashboard page in Jenkins. From here you can update Jenkins itself, install or remove plugins, and perform other management operations for Jenkins.